fDi's Top US Counties 2018: big cities bring home the investment
fDi's 2018 Top US Counties ranking shows that the areas attached to large cities are taking the lion's share of investment, as Cathy Mullan reports.
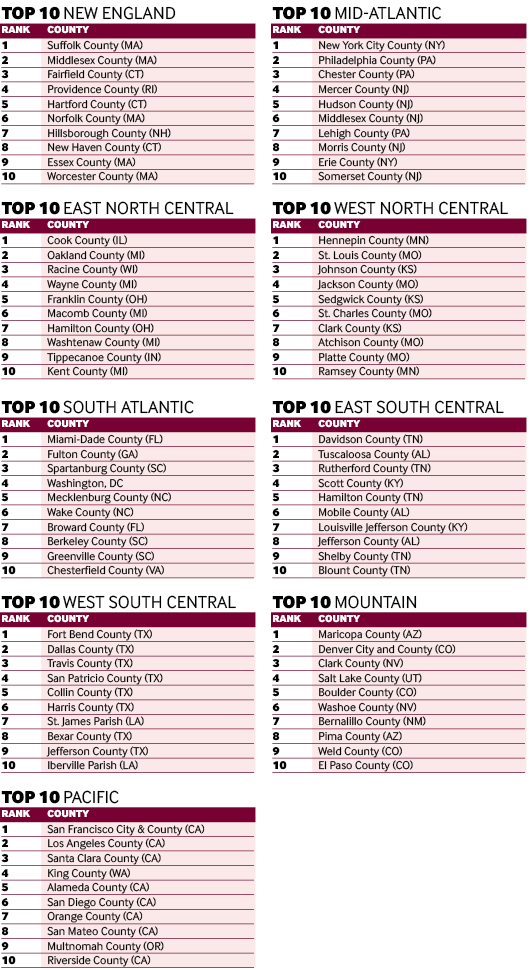
The most successful US counties for attracting FDI all have one thing in common: they are typically the seat of the main or most populous city in their state. Of all counties, perhaps unsurprisingly, the one with the highest number of FDI projects according to data from greenfield investment monitor fDi Markets is New York City County. Between 2013 and 2017, New York City County welcomed 850 FDI projects, more than 40% of which were in the software and IT services sector.
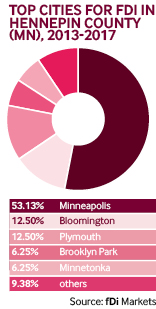
The spread of FDI in the counties that have topped the tables is heavily focused on their main cities, though some counties have a wider spread among secondary cities. For example, FDI in Fort Bend County in Texas, which topped the table for the West South Central region, was very heavily focused on Houston, which attracted more than 98% of the county’s FDI. By contrast, in Arizona’s Maricopa County (which tops the Mountain regional table), Phoenix attracted 37.8% of the county’s FDI, while Tempe received 17.6% and Scottsdale 13.5%. Minnesota’s Hennepin County (which ranks first in the West North Central region) is more widely spread, with 53.1% of investment going to Minneapolis, 12.5% to Plymouth, 12.5% to Bloomington, 6.3% to Minnetonka, 6.3% to Brooklyn Park and 9.4% to other cities in the county.
Though ranking second to San Francisco City and County in the Pacific regional table, Los Angeles County had the second highest level of job creation from FDI of all counties in the study. Almost three-quarters of all inbound investment was into Los Angeles, though some secondary cities in the county also attracted some major projects. BYD America, which manufactures electric vehicles and is a subsidiary of China-based BYD, expanded its electric vehicle manufacturing facility in Lancaster, some 110 kilometres north of Los Angeles. The expansion tripled the size and capacity of the plant, creating 667 jobs.
Methodology
To compile the list of locations for this study, fDi Intelligence, a data division of the Financial Times, looked at the FDI data between 2013 and 2017 for counties in the US. Locations were ranked on their record of investment considering project numbers, capital investment and job creation.


Global greenfield investment trends
Crossborder investment monitor
|
|
fDi Markets is the only online database tracking crossborder greenfield investment covering all sectors and countries worldwide. It provides real-time monitoring of investment projects, capital investment and job creation with powerful tools to track and profile companies investing overseas.
Corporate location benchmarking tool
fDi Benchmark is the only online tool to benchmark the competitiveness of countries and cities in over 50 sectors. Its comprehensive location data series covers the main cost and quality competitiveness indicators for over 300 locations around the world.
Research report
fDi Intelligence provides customised reports and data research which deliver vital business intelligence to corporations, investment promotion agencies, economic development organisations, consulting firms and research institutions.
Find out more.


