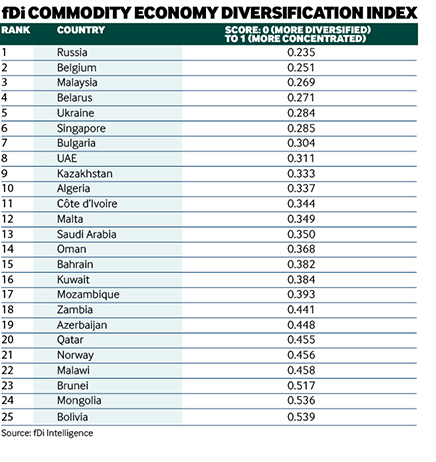
Russia has been ranked as the most diversified commodity economy in the fDi Commodity Economy Diversification Index. The eastern European powerhouse scored 0.235, and was followed by Belgium (0.251), Malaysia (0.269), Belarus (0.271) and Ukraine (0.284).
Russia attracted more than 4000 greenfield FDI projects between 2003 and 2015, spread across 39 different sectors (the maximum number in the survey). The country’s principal FDI sectors during this period in terms of project numbers were financial services, industrial machinery, food and tobacco, and real estate. Top companies by number of projects include Austria’s RaiffeisenZentral Bank (financial services), Siemens (various industries), Enforta (telecommunications) and Ikea (furniture). In July, the International Monetary Fund revised Russia’s GDP prospects after the rebound in oil prices. However, the country’s productivity and investment climate are still expected to be affected by Western sanctions. Its economy is predicted to have contracted by -3.7% in 2015, and then by -1.2% in 2016 before growing by 1% in 2017.
Advertisement
Distant second
Belgium reported fewer than half Russia’s number of inward FDI projects (1681), but had only a slightly less diverse spread. It had a higher focus on its top sectors – business services and software and IT, which each accounted for more than 10% of the country’s total FDI – than Russia, whose top sector accounted for just under 10% of its total number of FDI projects.
Of the 25 locations analysed, there was a relatively strong correlation between how diversified a commodity economy is and the number of FDI projects it received. In general, the higher the number of FDI projects received, the more diversified the economy in terms of FDI (a lower index score).
The index analysed 25 commodity economies across 39 FDI sectors to determine how diversified their levels of greenfield FDI have been since 2003. fDi used the Hirschman Index for export diversification as a base and calculated a score for FDI projects and capital investment using data from greenfield investment monitor fDi Markets.
The scores for each location ranged between zero (fully diversified) and one (fully specialised). The lower the score, the more diversified the economy is in terms of FDI; the higher the score, the more concentrated.
Methodology
Advertisement
The fDi Diversification Index is a weighted average of the fDi Diversification Score for FDI projects and FDI capital investment. For FDI projects, the result is the square root of the sum of the square of the number of projects in 'sector x', divided by the total number of projects, for each of the sectors in which the location receives FDI. The index then applies equal weight (50%:50%) to both projects and capital investment figures to give the overall index score.
The list of locations was devised by analysing economies with at least 20% of their GDP derived from commodity exports* and a minimum of 20 inward greenfield FDI projects. A total of 25 economies met those criteria.
* HS codes included 9-10; 17-18; 24-29; 52; 72-80.
