Of all the foreign stocks and bonds held by Americans, around 15% are issued by firms in the Cayman Islands. These holdings exceed US portfolio investment in Germany or Spain — countries whose economies are hundreds of times larger than the small Caribbean island. How can this be?
Economists have long understood that standard international financial statistics associate a security’s location with the residency of its issuer, not with the nationality of the ultimate parent company. So, regardless of where a multinational corporation conducts its operations or locates its headquarters, if it raises capital by issuing a bond through its Cayman Islands subsidiary, purchases of that bond will be recorded as portfolio investments in the Cayman Islands.
Advertisement
For most purposes, it is not useful to treat these enormous positions as connecting investors to economic activity in the Cayman Islands or other tax havens, such as Bermuda, the Channel Islands and the British Virgin Islands. Our recent academic work offers an alternative: we use several security-by-security datasets to unwind complex corporate hierarchies and connect affiliates in one country with their ultimate parents in another. We then use this parent–subsidiary mapping, together with data on who owns these stocks and bonds around the world, to reallocate portfolio investment positions in tax havens.
Larger corporate bond positions in Brics
Our restatements demonstrate that the exposure of developed countries to corporate bonds issued by large emerging markets, such as Brazil, Russia, India, China and South Africa (Brics), vastly outstrips what one would find from the standard official statistics. For example, European companies hold billions of dollars in bonds issued by the Luxembourg-resident firm Gaz Capital. Our algorithm links Gaz Capital to its parent, the Russian energy giant Gazprom, and adjusts the bilateral investment data accordingly.
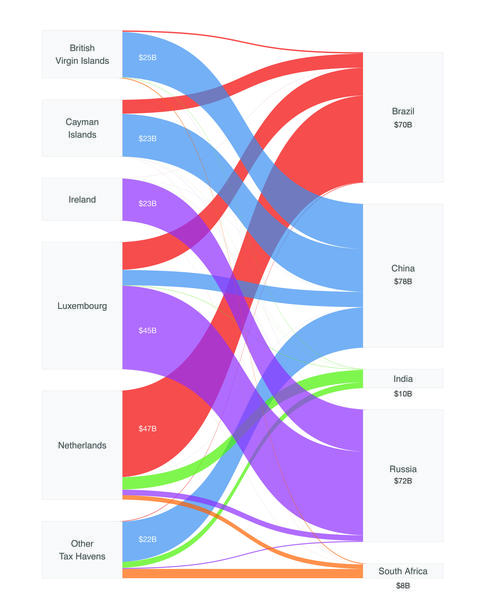
These positions contribute to the purple link in Figure 1, showing $45bn of bonds issued by Luxembourg-based subsidiaries of Russian firms and held by Eurozone investors. Eurozone investors also have substantial positions in securities issued by Petrobras Global Finance, the Dutch affiliate of the Brazilian firm Petrobras. These positions contribute to the red link in Figure 1, showing $47bn of bonds issued by Dutch subsidiaries of Brazilian firms.
Whereas data collected by the IMF and national central banks report that less than 3% of the Eurozone’s external bond portfolio is held in Brics country debt, we demonstrate that after including bonds issued by corporate affiliates located in tax havens, the Eurozone’s bond exposure to the Brics more than doubles. This pattern is similar for other advanced economy investors.
After taking into account the bonds issued by tax haven affiliates of Brics firms, the bond exposures to the Brics countries also more than doubles for Australia, Denmark, Sweden, Switzerland and the US.
Advertisement
Larger equity positions in China
Firms also issue equities through foreign affiliates. For example, as has been widely discussed, several US firms, such as Medtronic, have relocated their headquarters to Ireland for tax purposes, despite the bulk of their operations being located in the US. Our results suggest that US equity exposure to Ireland is five times larger in the US national statistics than it would be without such tax inversions.
The largest equity reallocation exposed in our work, however, involves China. Chinese law forbids foreign investments in strategic industries, such as certain internet and technology sectors. To circumvent this restriction, prominent corporations, including Alibaba, Baidu, JD.com and Tencent, use what is known as a variable interest entity (VIE) structure. Through this, a firm owned by Chinese nationals can engage in a series of contracts with a wholly foreign-owned enterprise (WFOE). The WFOE is owned by a third company, typically a shell company in the Cayman Islands, that issues equity, and is entitled to receive operating profits and control rights without owning the operating company outright. This means that when investors purchase stock in Alibaba, for example, they are purchasing equity claims on a holding company resident in the Cayman Islands.
The ubiquity of the VIE structure means that more than $500bn of US equity investments in the Cayman Islands are best thought of as carrying exposures to China. Including these investments, China grows from about 2% of the external equity portfolios of both the US and Europe, to 7% and 10%, respectively. When we include equity investments in VIEs as investments in China, investment exposures to China surge for all developed countries that we study.
Sales-based investment exposures
For most economic analyses, it is helpful to ‘look through’ the shell companies located in tax havens and associate investments with the geography of the issuer’s ultimate parent, as described above. For some purposes, it may be additionally useful to then take into account the full geography of that ultimate parent firm’s consolidated sales, potentially associating a given equity investment with multiple geographies. Doing so offers a different perspective on how the patterns of global demand for goods and services affect investors.
For example, it is well known that investors disproportionately invest in domestic firms, which potentially suggests they are forgoing some benefits from diversification across foreign countries. Accounting for the foreign sales made by domestic firms attenuates this concern.
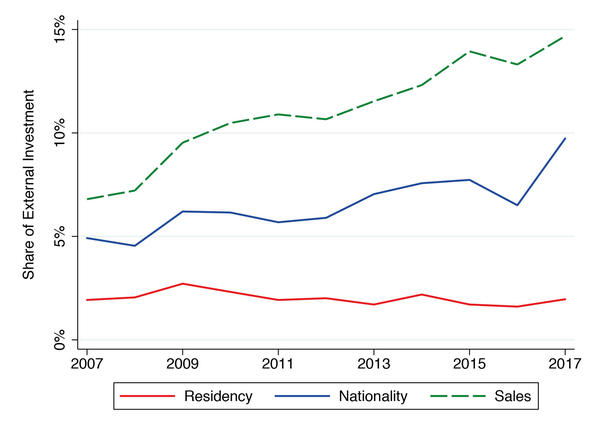
Further, moving from the official data to our measure that associates tax haven affiliates with their ultimate parents, and then moving again from that measure to one that accounts for the global distribution of sales, markedly changes the view of portfolio exposures to China. Ray Dalio, the founder of Bridgewater Associates, recently wrote in an opinion piece for the Financial Times, “the world is underweight Chinese stocks and bonds. These currently account for 3% or less of foreign portfolio holdings; a neutral weight would be closer to 15%.”
Figure 2 demonstrates that Dalio’s “3% or less” is quite close to what is found in official statistics on China’s share of US foreign equity holdings during 2007–2017 (labelled ‘Residency’ in the figure). When we associate securities issued by Chinese affiliates in tax havens with China, we obtain a higher and growing series that approaches 10% by 2017 (labelled ‘Nationality’). Finally, our calculation of US equity exposure to China, that takes into account the share of companies’ sales to China, reaches the 15% level postulated as neutral by Dalio by 2017 (labelled ‘Sales’).
Global capital allocation project
The path from corporate and sovereign borrowers to foreign lenders of capital has gotten more complex, and increasingly routes through tax havens. Our research initiative, the Global Capital Allocation Project, offers a variety of tools and results (including those summarised above) to help academics, policymakers, and practitioners see through these intermediaries and better understand the pattern of bilateral portfolio investment. As cross-border financial ties become deeper and more complex, it is more challenging and even more essential to understand who owns what around the globe.
Antonio Coppola is a doctoral student in economics at Harvard University. Matteo Maggiori, Brent Neiman, and Jesse Schreger are professors at Stanford University, The University of Chicago, and Columbia University, respectively.
This article is based on: Coppola, Maggiori, Neiman & Schreger. Redrawing the map of global capital flows: the role of cross-border financing and tax havens. The Quarterly Journal of Economics 2021;qjab014. doi: 10.1093/qje/qjab014
This article first appeared in the June/July print edition of fDi Intelligence.

